Ratio of selling, general and administrative expenses to net sales (%)
21.1
23.8
23.2
24.3
24.7
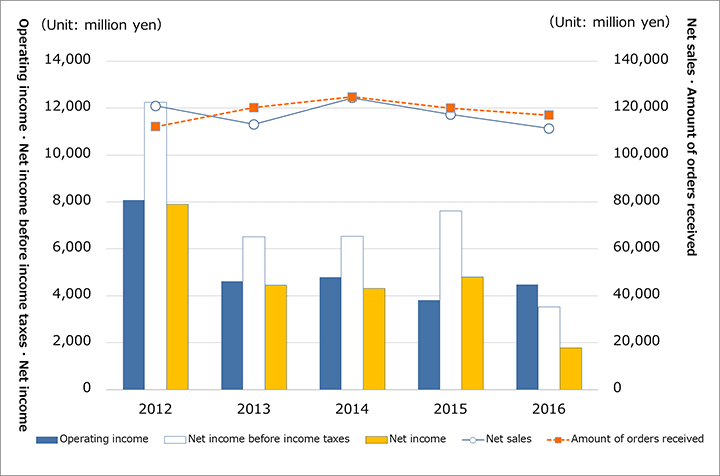
Operating income
8,078
4,625
4,788
3,806
4,473
Operating income ratio (%)
6.7
4.1
3.8
3.2
4.0
Net income before income taxes
12,239
6,507
6,522
7,608
3,523
Ratio of net income before income taxes to net sales (%)
10.1
5.8
5.2
6.5
3.2
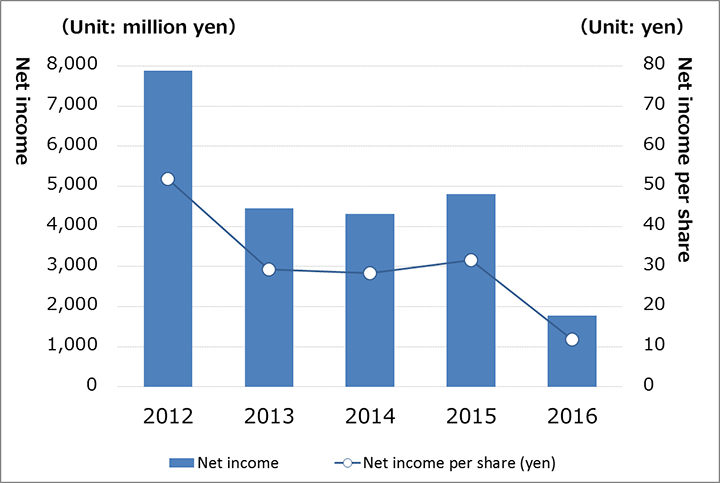
Net income
7,891
4,444
4,312
4,806
1,776
Ratio of net income to net sales (%)
6.5
3.9
3.5
4.1
1.6
Note: Until 2012, royalty income received from related companies and others to whom the company provided its technology was booked as other income. Since 2013, however, such royalty has been included in net sales, and data for 2011 and 2012 were retroactively adjusted accordingly.
Note: Until 2012, royalty income received from related companies and others to whom the company provided its technology was booked as other income. Since 2013, however, such royalty has been included in net sales, and data for 2011 and 2012 were retroactively adjusted accordingly.
Note 1: Sales by quarter mentioned above were calculated by subtracting differences from the segment information published in the summary of financial results. Note 2: Until 2012, royalty income received from related companies and others to whom the company provided its technology was booked as other income. Since 2013, however, such royalty has been included in net sales, and data for 2011 and 2012 were retroactively adjusted accordingly. Note 3: Net sales in the table include intersegment sales. Note 4: Until 2012, royalty income received from related companies and others to whom the company provided its technology was booked as other income. Since 2013, however, such royalty has been included in net sales, and data for 2011 and 2012 were retroactively adjusted accordingly.
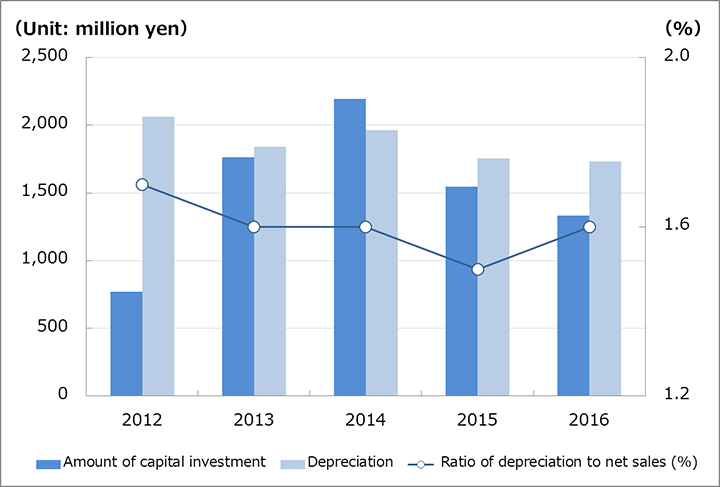
Amount of capital investment,Depreciation,Research and development costs
Unit: million yen / fiscal year
2012
2013
2014
2015
2016
Amount of capital investment
769
1,766
2,193
1,547
1,335
Ratio of amount of capital investment to net sales (%)
0.6%
1.6%
1.8%
1.3%
1.2%
Depreciation
2,065
1,840
1,965
1,756
1,730
Ratio of depreciation to net sales (%)
1.7%
1.6%
1.6%
1.5%
1.6%
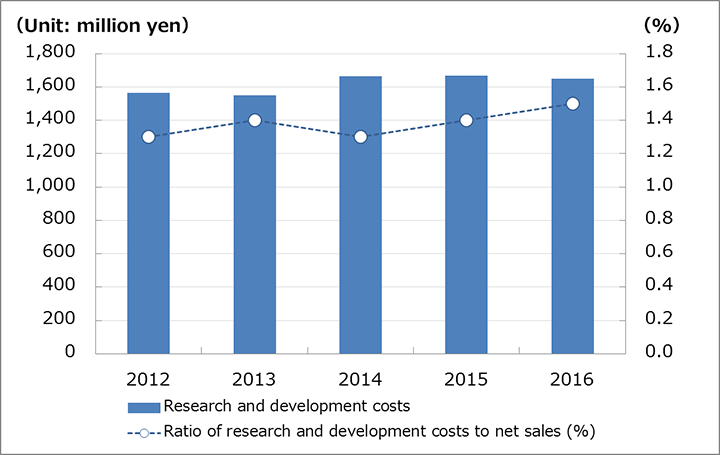
Research and development costs
1,566
1,551
1,663
1,668
1,648
Ratio of research and development costs to net sales (%)
1.3%
1.4%
1.3%
1.4%
1.5%
Note : Until 2012, royalty income received from related companies and others to whom the company provided its technology was booked as other income. Since 2013, however, such royalty has been included in net sales, and data for 2011 and 2012 were retroactively adjusted accordingly.
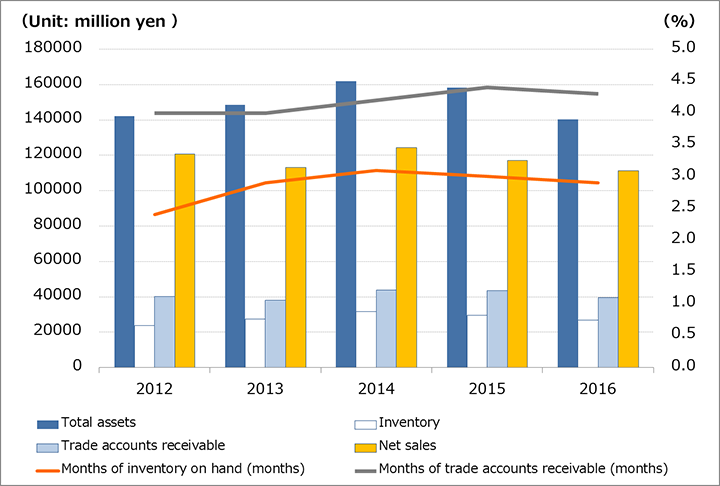
Respective indices of inventory and trade accounts receivable
Unit: million yen / fiscal year
2012
2013
2014
2015
2016
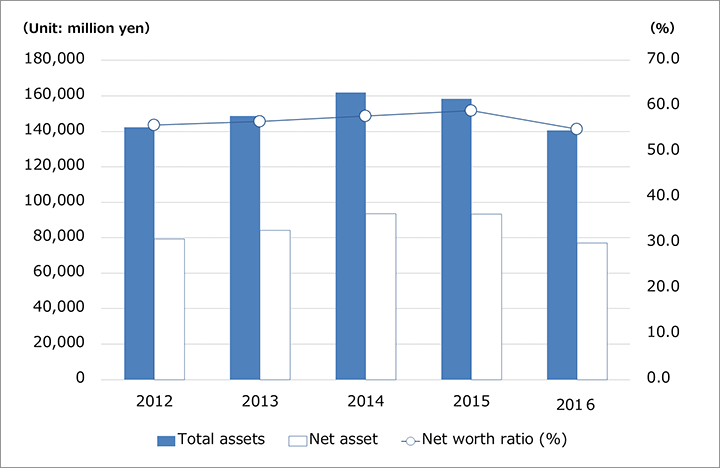
Total assets
142,239
148,680
161,975
158,310
140,530
Inventory
23,844
27,318
31,767
29,450
26,713
Months of inventory on hand (months) Inventory at end of year / monthly average of net sales through year
2.4
2.9
3.1
3.0
2.9
Trade accounts receivable
40,006
37,951
43,751
43,425
39,444
Months of trade accounts receivable (months) Trade accounts receivable at end of year / monthly average of net sales through year
4.0
4.0
4.2
4.4
4.3
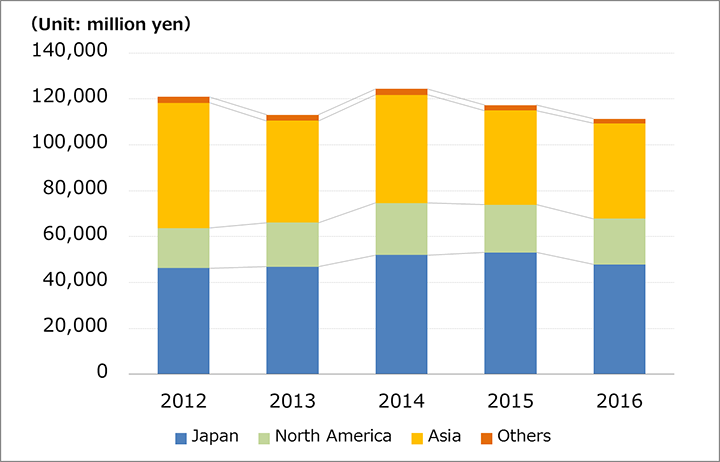
Net sales
120,899
113,062
124,373
117,259
111,327
Note : Until 2012, royalty income received from related companies and others to whom the company provided its technology was booked as other income. Since 2013, however, such royalty has been included in net sales, and data for 2011 and 2012 were retroactively adjusted accordingly.